Hinoe Uma – the 'Fire Horse'
For Japanese people, every single day has astrological associations with good luck, misfortune, or something in between. (See also Rokuyo)
As with most other people in the world, such superstitions are largely ignored in everyday living, but one in particular is so ingrained into the very fabric of Japanese life, that it could partly explain the significant drop in the Japanese birth rate.
The culprit: Hinoe Uma.
丙午 Hinoe-Uma (the 'Fire Horse') and the declining birth rate in Japan
Hinoe-Uma is a calendar event that occurs every 60 years. The last was in 1966 and the next will be in 2026.
As with the astrological birth signs of the West, the Japanese use modified Chinese astrology; a 12-year cycle of astrological beasts. 1966 was the Year of the Horse, but it was a special kind of rather nasty horse; a Fire Horse, or hinoe-uma in Japanese.
Girls born in that year became known as 'Fire Horse Women' and are reputed to be dangerous, headstrong and generally bad luck for any husband. In 1966, a baby's sex couldn't be reliably detected before birth; hence there was a large increase of induced abortions and a sharp decrease in the birth rate in 1966.
Why did the population growth not continue its post-war upward trend in the following years? The birth rate did have a massive surge in 1967 but since few women had babies in 1966, fewer women left work that year for maternity. This significantly increased the proportion of working women in 1966 and may have triggered a general trend of more working women, leading to a reduction in the birth rate and fewer babies.
There are alternative theories as to why the birth rate declined, but the superstition explanation is more fun. Stay tuned for the next Fire Horse year in 2026.
Stats
According to the OECD (stats.oecd.org/...), the annual percentage growth rate in Japan twixt 1960 and 1970 was:
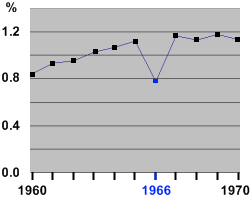
1960 0.84%
1961 0.93%
1962 0.95%
1963 1.02%
1964 1.06%
1965 1.12%
1966 0.77%
1967 1.16%
1968 1.12%
1969 1.17%
1970 1.13%
(Post-war poverty resulted in a steep drop prior to 1960, followed by sustained growth as the country recovered. The rate peaked in the early 70's and has declined ever since. In 2006 the growth rate was zero and it continues to fall. The 2020 rate is projected to be -0.5%.)
But that was then
Today, the topic is not discussed very much; and that's because of apathy rather than any stigma.
In the West, predictions based on the Zodiac are printed in Western newspapers, but few people take it seriously. Similarly in Japan; some people may choose to marry on a certain Lucky Day, but most people treat it as a light-hearted amusement. For sure, there are still people in Japan who queue up to see the fortune tellers on railway station forecourts, but most people walk on by.
And Hinoe-Uma is way down in the league of current Japanese curiosities.
This is the assumed birth rate. Hospitals are not obliged to report live deliveries; only stillbirths. The birth rate is actually based on the number of babies registered. It is possible some people delayed registering baby girls born in the latter part of 1966.